
Data from the National Vital Statistics System
The CDC National Center for Health Statistics released the Mortality in the United States; 2017 report.
- Life expectancy for the U.S. population declined to 78.6 years in 2017.
- The age-adjusted death rate increased by 0.4% from 728.8 deaths per 100,000 standard population in 2016 to 731.9 in 2017.
- Age-specific death rates increased from 2016 to 2017 for age groups 25–34, 35–44, and 85 and over, and decreased for the age group 45–54.
- The 10 leading causes of death in 2017 remained the same as in 2016.
- The infant mortality rate of 579.3 infant deaths per 100,000 live births in 2017 was not significantly different from the 2016 rate.
- The 10 leading causes of infant death in 2017 remained the same as in 2016 although 4 causes changed ranks.
Figure 1. Life expectancy at selected ages, by sex: United States, 2016 and 2017
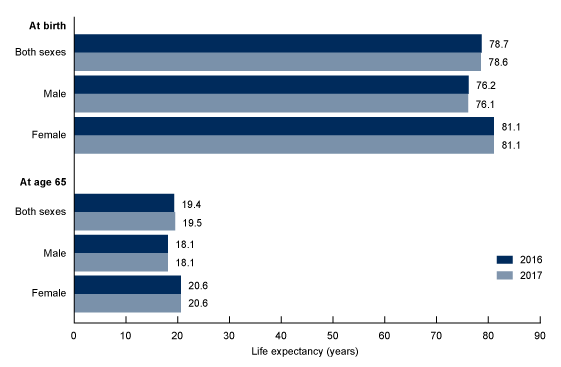
NOTES: Life expectancies for 2016 were revised using updated Medicare data; therefore, figures may differ from those previously published. Access data table for Figure 1
SOURCE: NCHS, National Vital Statistics System, Mortality.
SOURCE: NCHS, National Vital Statistics System, Mortality.
No comments:
Post a Comment